3  R Markdown

R Markdown lets us combine narrative text, code, and output in one reproducible document. In software engineering, this is very useful for:

3.1 Basic Structure

A typical R Markdown / Quarto document contains:

  • headings and text written in Markdown
  • code chunks (R, Python, etc.)
  • generated output (tables, plots, metrics)

The rendering process executes the chunks and creates HTML/PDF/Word output.

3.2 Code Chunks

Chunks start and end with triple backticks and a chunk header.

# Example software metrics dataset
se_metrics <- data.frame(
    module = c("Auth", "Billing", "Search", "UI", "Export"),
    loc = c(220, 540, 430, 310, 270),
    cyclomatic = c(12, 25, 19, 14, 11),
    defects = c(0, 3, 2, 1, 0)
)

summary(se_metrics)
    module               loc        cyclomatic      defects   
 Length:5           Min.   :220   Min.   :11.0   Min.   :0.0  
 Class :character   1st Qu.:270   1st Qu.:12.0   1st Qu.:0.0  
 Mode  :character   Median :310   Median :14.0   Median :1.0  
                    Mean   :354   Mean   :16.2   Mean   :1.2  
                    3rd Qu.:430   3rd Qu.:19.0   3rd Qu.:2.0  
                    Max.   :540   Max.   :25.0   Max.   :3.0  

3.3 Useful Chunk Options

  • echo=FALSE: hide code, show results
  • message=FALSE: hide package startup messages
  • warning=FALSE: hide warnings
  • eval=FALSE: show code but do not run it
   module defects
1    Auth       0
2 Billing       3
3  Export       0
4  Search       2
5      UI       1

3.4 Inline Code

You can insert computed values directly in text.

Example: the total number of defects in this sample is 6.

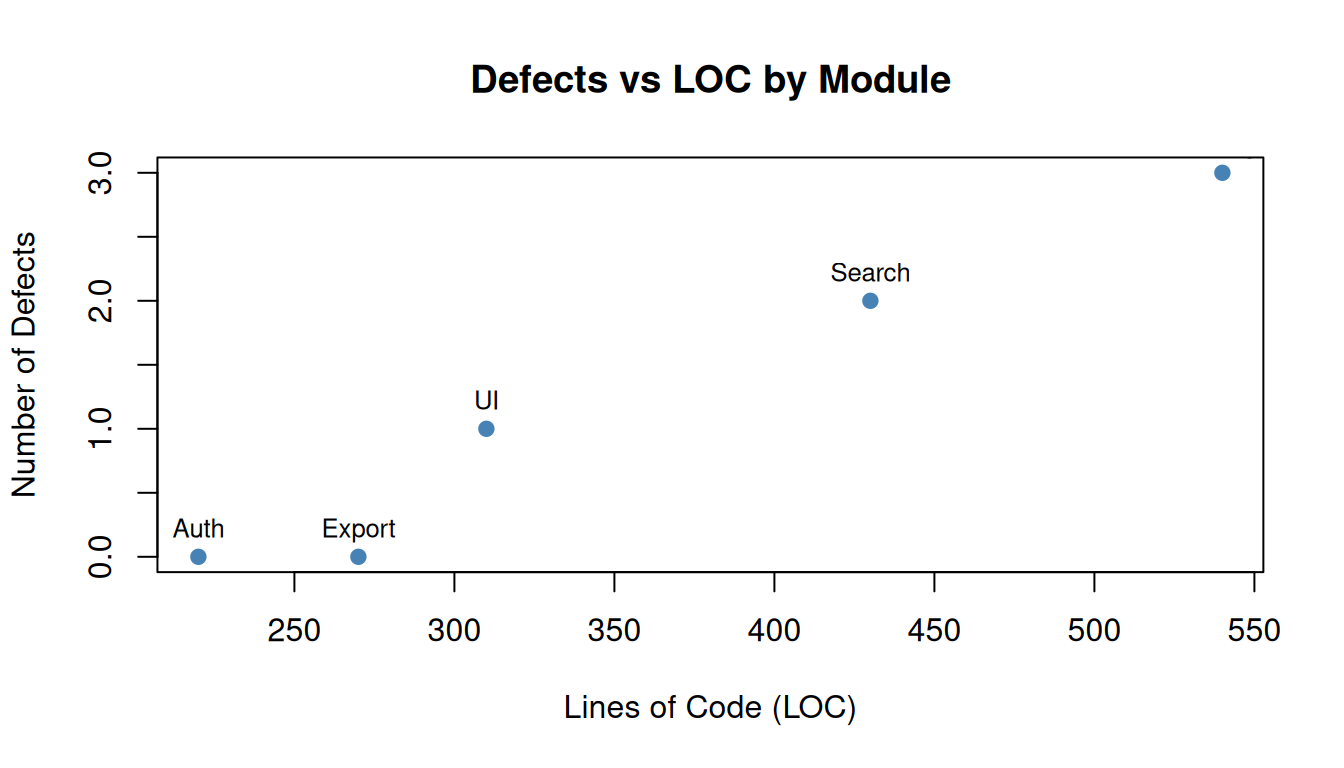
3.5 Plot Example (Software Engineering)

plot(
    se_metrics$loc,
    se_metrics$defects,
    xlab = "Lines of Code (LOC)",
    ylab = "Number of Defects",
    main = "Defects vs LOC by Module",
    pch = 19,
    col = "steelblue"
)
text(se_metrics$loc, se_metrics$defects, labels = se_metrics$module, pos = 3, cex = 0.8)

3.6 Reproducibility Tips

  • set a random seed for experiments (set.seed(...))
  • keep data-loading code in the document
  • report metrics and plots in the same file
  • avoid manual copy/paste of results into reports

3.7 Further Information