Chapter 2 Split data into training and test datasets
jdt2 = data.frame(cbo, bugs) inTrain <- createDataPartition(y=jdt2$bugs,p=.8,list=FALSE) jdtTrain <- jdt2[inTrain,] jdtTest <- jdt2[-inTrain,]
BLR models fault-proneness are as follows $fp(X) = \frac{e^{logit()}}{1 + e^{logit(X)}}$

where the simplest form for logit is $logit(X) = c_{0} + c_{1}X$


```r
# logit regression
# glmLogit <- train (bugs ~ ., data=jdt.train, method="glm", family=binomial(link = logit))

glmLogit <- glm (bugs ~ ., data=jdtTrain, family=binomial(link = logit))
summary(glmLogit)
##
## Call:
## glm(formula = bugs ~ ., family = binomial(link = logit), data = jdtTrain)
##
## Deviance Residuals:
## Min 1Q Median 3Q Max
## -3.654 -0.591 -0.515 -0.471 2.150
##
## Coefficients:
## Estimate Std. Error z value Pr(>|z|)
## (Intercept) -2.20649 0.13900 -15.87 <2e-16 ***
## cbo 0.06298 0.00765 8.23 <2e-16 ***
## ---
## Signif. codes: 0 '***' 0.001 '**' 0.01 '*' 0.05 '.' 0.1 ' ' 1
##
## (Dispersion parameter for binomial family taken to be 1)
##
## Null deviance: 807.98 on 797 degrees of freedom
## Residual deviance: 691.80 on 796 degrees of freedom
## AIC: 695.8
##
## Number of Fisher Scoring iterations: 5Predict a single point:
newData = data.frame(cbo = 3)
predict(glmLogit, newData, type = "response")
## 1
## 0.117Draw the results, modified from: http://www.shizukalab.com/toolkits/plotting-logistic-regression-in-r
results <- predict(glmLogit, jdtTest, type = "response")

range(jdtTrain$cbo)
## [1] 0 156range(results)## [1] 0.0992 0.9993plot(jdt2$cbo,jdt2$bugs)
curve(predict(glmLogit, data.frame(cbo=x), type = "response"),add=TRUE)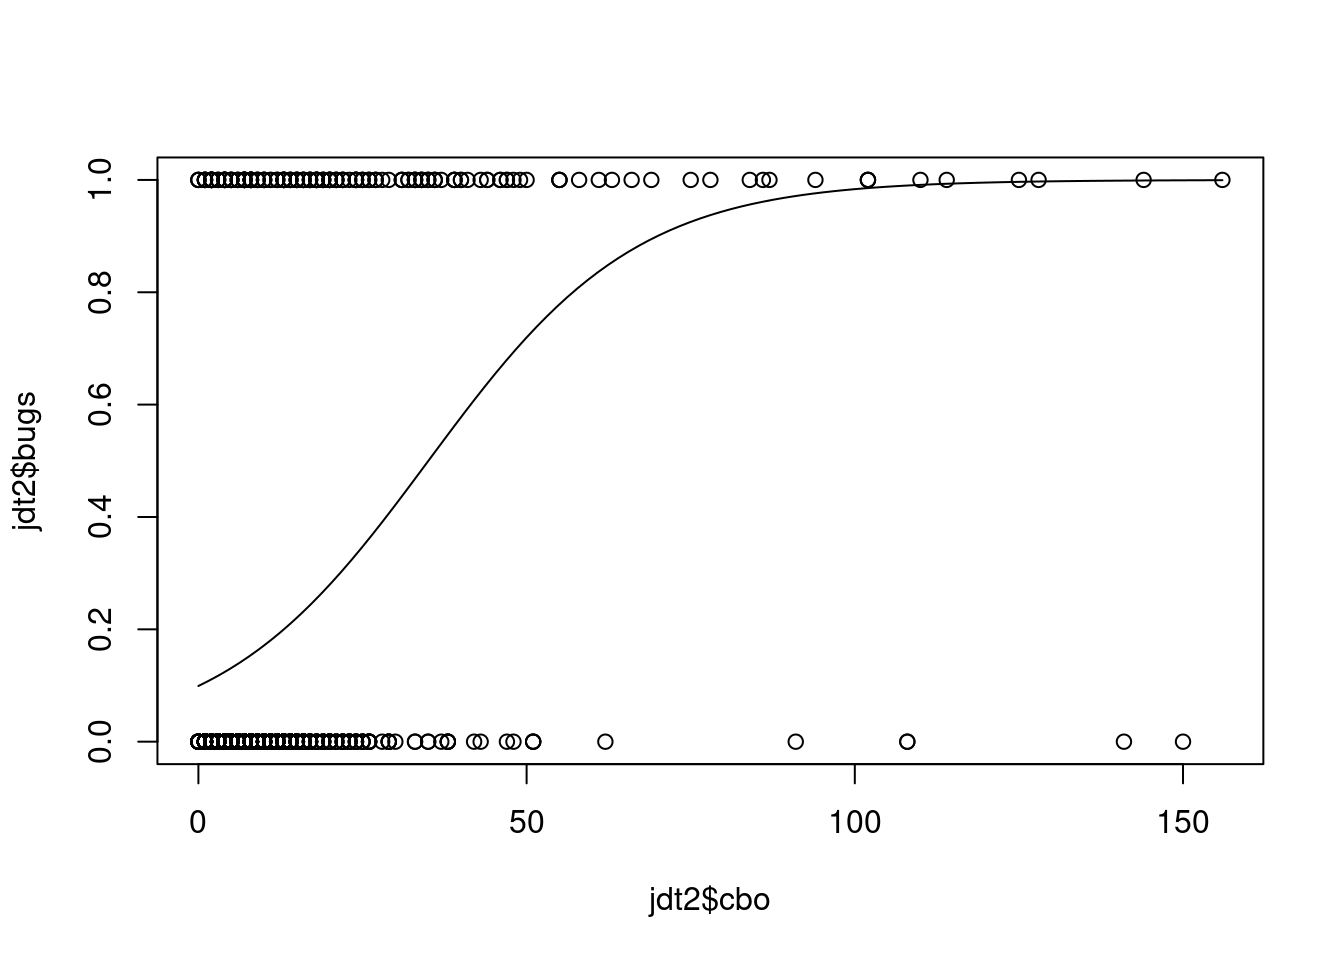
# points(jdtTrain$cbo,fitted(glmLogit))Another type of graph:
library(popbio)##
## Attaching package: 'popbio'## The following object is masked from 'package:caret':
##
## sensitivitylogi.hist.plot(jdt2$cbo,jdt2$bugs,boxp=FALSE,type="hist",col="gray")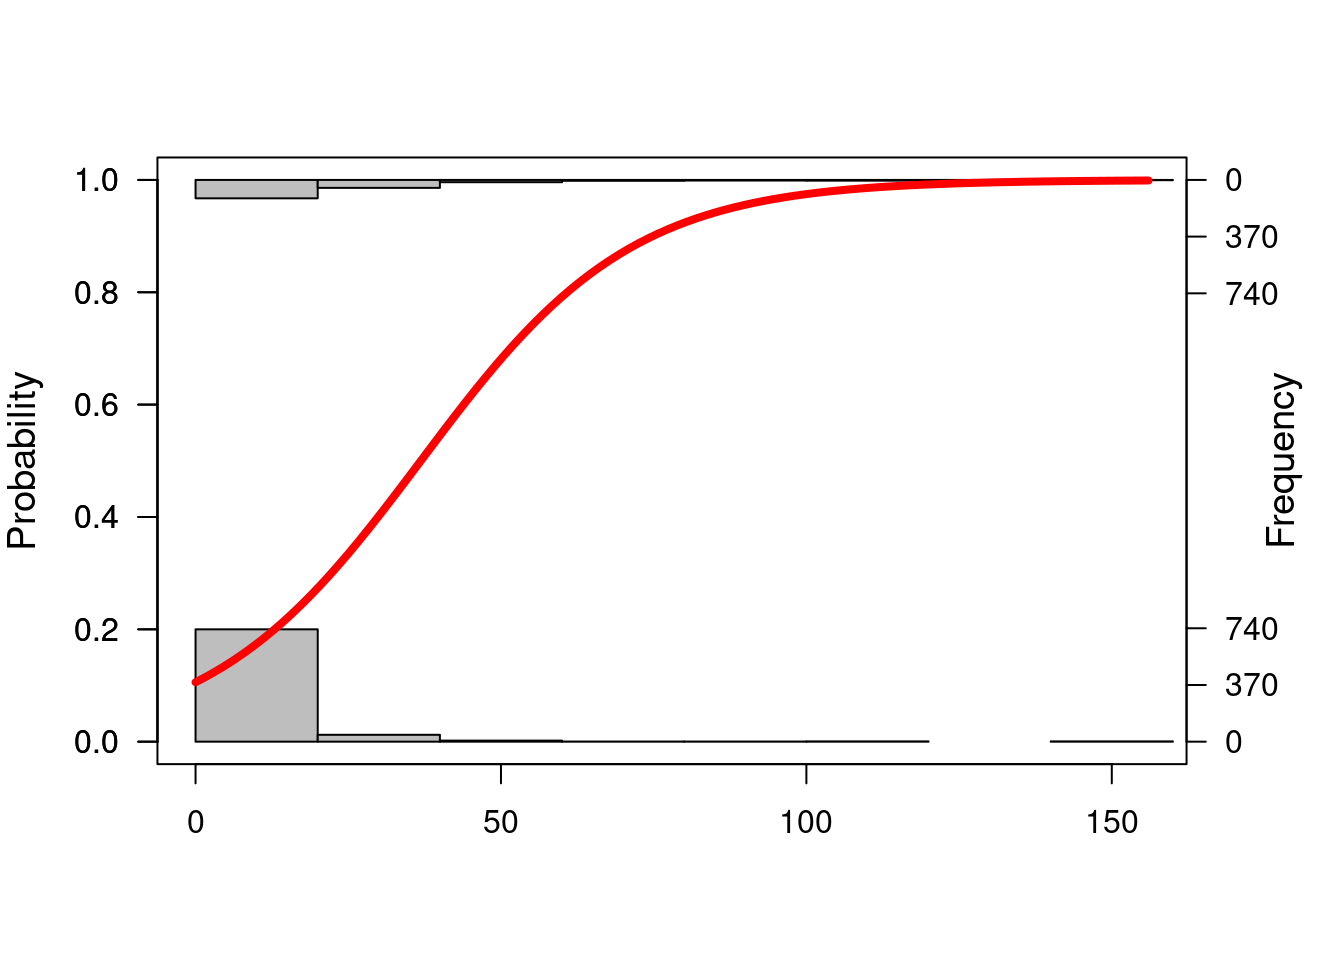
2.1 The caret package
There are hundreds of packages to perform classification task in R, but many of those can be used throught the ‘caret’ package which helps with many of the data mining process task as described next.
The caret packagehttp://topepo.github.io/caret/ provides a unified interface for modeling and prediction with around 150 different models with tools for:
data splitting
pre-processing
feature selection
model tuning using resampling
variable importance estimation, etc.
Website: http://caret.r-forge.r-project.org
JSS Paper: www.jstatsoft.org/v28/i05/paper