Chapter 4 Unsupervised or Descriptive modeling
From the descriptive (unsupervised) point of view, patterns are found to predict future behaviour or estimate. This include association rules, clustering, or tree clustering which aim at grouping together objects (e.g., animals) into successively larger clusters, using some measure of similarity or distance. The dataset will be as the previous table without the \(C\) class attribute
| Att1 | Attn | |
|---|---|---|
| a11 | … | a1n |
| a21 | … | a2n |
| … | … | … |
| am1 | … | amn |
4.1 Clustering
library(foreign)
library(fpc)

kc1 <- read.arff("./datasets/defectPred/D1/KC1.arff")

# Split into training and test datasets
set.seed(1)
ind <- sample(2, nrow(kc1), replace = TRUE, prob = c(0.7, 0.3))
kc1.train <- kc1[ind==1, ]
kc1.test <- kc1[ind==2, ]

# No class
kc1.train$Defective <- NULL

ds <- dbscan(kc1.train, eps = 0.42, MinPts = 5)

kc1.kmeans <- kmeans(kc1.train, 2)4.2 Association rules
library(arules)
# x <- as.numeric(kc1$LOC_TOTAL)
# str(x)
# summary(x)
# hist(x, breaks=30, main="LoC Total")
# xDisc <- discretize(x, categories=5)
# table(xDisc)
for(i in 1:21) kc1[,i] <- discretize(kc1[,i], method = "interval", breaks = 5)
rules <- apriori(kc1,
parameter = list(minlen=3, supp=0.05, conf=0.35),
appearance = list(rhs=c("Defective=Y"),
default="lhs"),
control = list(verbose=F))
#rules <- apriori(kc1,
# parameter = list(minlen=2, supp=0.05, conf=0.3),
# appearance = list(rhs=c("Defective=Y", "Defective=N"),
# default="lhs"))
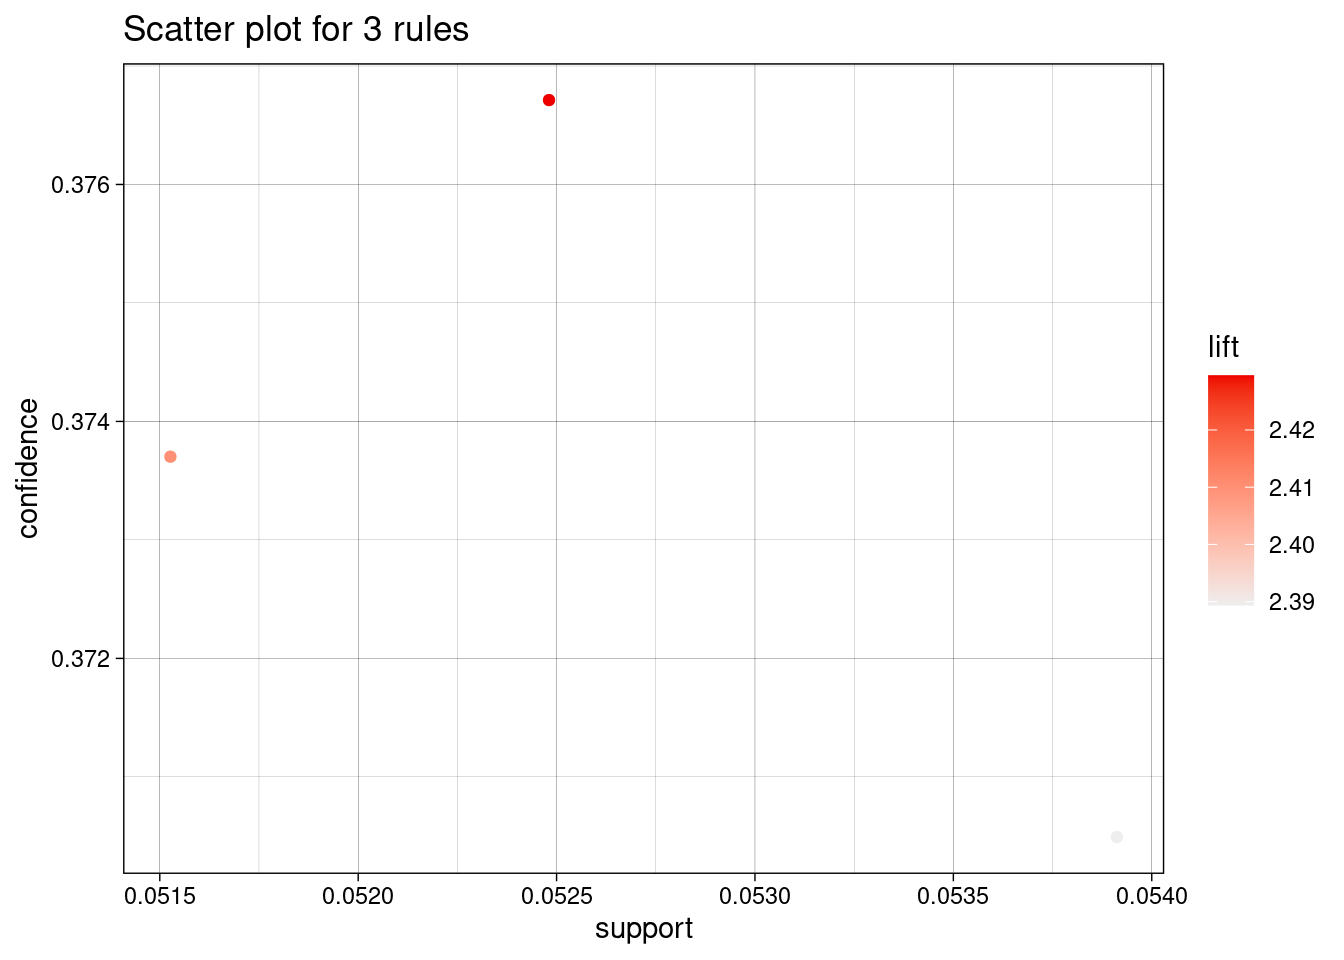
inspect(rules)## lhs rhs support confidence coverage lift count
## [1] {HALSTEAD_CONTENT=[38.6,77.2),
## HALSTEAD_LEVEL=[0,0.4)} => {Defective=Y} 0.0539 0.370 0.146 2.39 113
## [2] {LOC_CODE_AND_COMMENT=[0,2.4),
## HALSTEAD_CONTENT=[38.6,77.2)} => {Defective=Y} 0.0525 0.377 0.139 2.43 110
## [3] {LOC_CODE_AND_COMMENT=[0,2.4),
## HALSTEAD_CONTENT=[38.6,77.2),
## HALSTEAD_LEVEL=[0,0.4)} => {Defective=Y} 0.0515 0.374 0.138 2.41 108library(arulesViz)
plot(rules)